

For the past 20 years, China has been a powerhouse of growth as the country created a cycle of prosperity that resulted in rapid economic development. Countries around the globe outsourced their manufacturing to China, which led to the creation of vast factories and the transformation of China's population into an urbanized labour force.
Recently, China's economic outlook has faltered. There has been increasing evidence that China’s growth engine has begun to sputter, with rising problems in the real estate market,1 stories of vast numbers of unsold homes,2 and record levels of joblessness among young adults.3 While the global markets have generally viewed these issues as temporary cyclical problems that would soon be corrected by either government action or a cyclical rebound, we believe they are indicators of much deeper problems with the growth model that China has relied upon for the past two decades.
With many forecasters expecting China to continue to be the largest single contributor to short- and medium-term global economic growth,4 a significant shortfall could prove disruptive to global equity, bond and commodity markets. In this paper, we will explore the key underlying drivers of China’s past growth and explore how they are likely to evolve in the future. In our view, China’s past growth will be extremely difficult to maintain going forward.
The world’s growth engine
In 2001, China joined the World Trade Organization (WTO)5 resulting in a profound shift in the Chinese economy. While China had already been growing rapidly, joining the WTO allowed the nation to become the “factory to the world”. Over the next two decades, China went from manufacturing 13% of the world’s goods to producing a staggering 30%.6 As China’s manufacturing sector grew rapidly, the country engaged in a massive wave of urbanization and industrialization. Over the past two decades, over 400 million people have moved from rural areas to cities, necessitating a globally unprecedented building boom.
While there is no single statistic that covers the scale of China’s construction wave, there are a number that hint at its staggering magnitude.
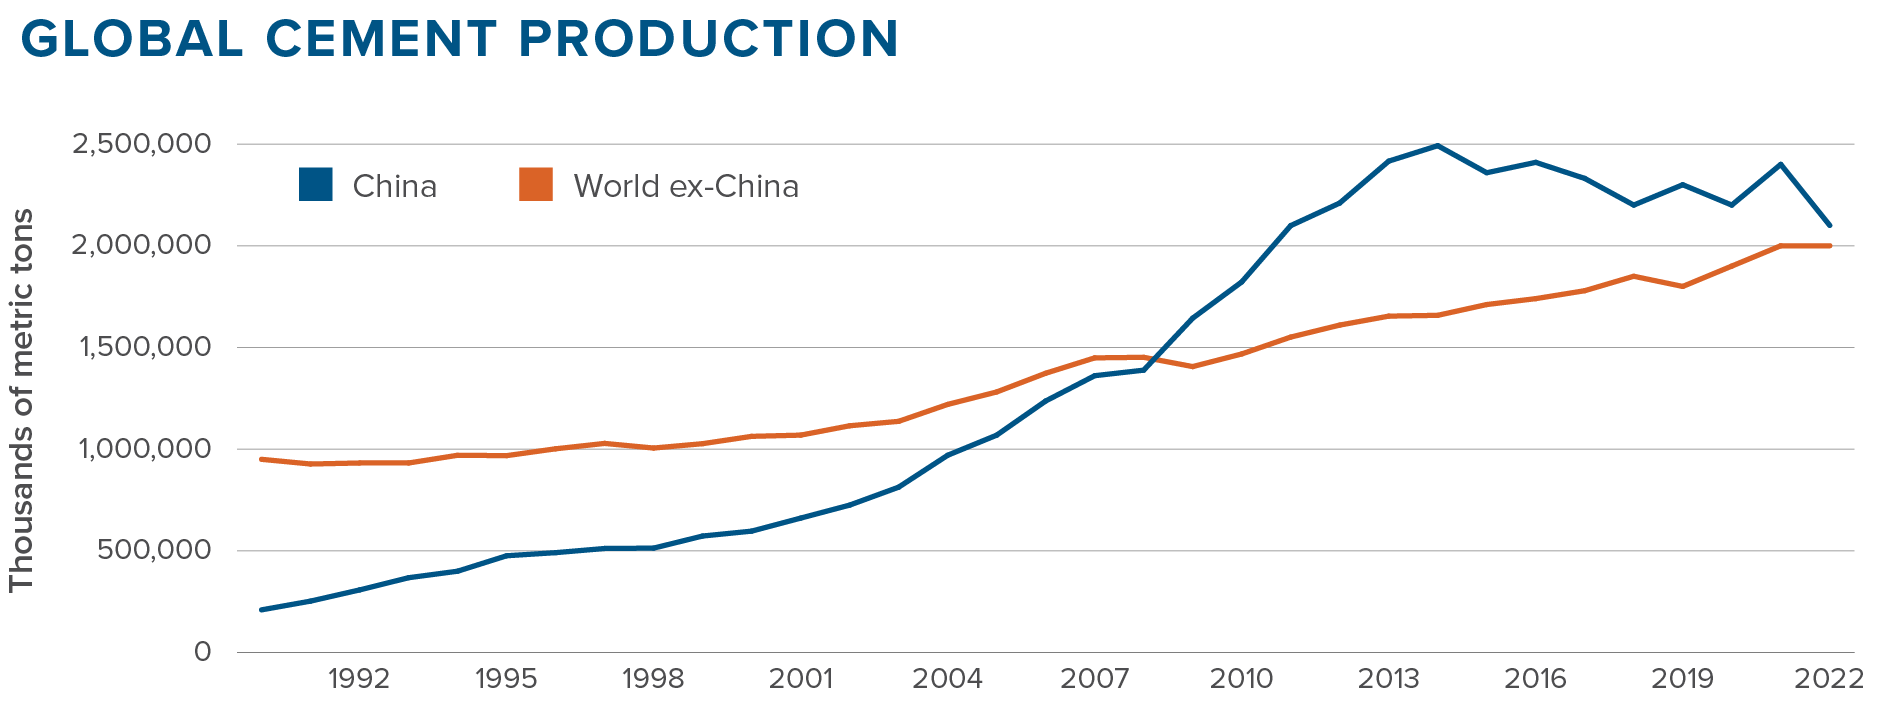
Cement is a key building material that is used in close proximity to where it is produced. In 1990, China produced roughly 20% as much cement as the rest of the world, a number roughly in line with China’s share of the world's population. By the peak in the middle of last decade, China was producing 50% more cement than the rest of the world combined, and over a three-year period had used more cement than the United States had over the entire twentieth century.7 This massive jump in cement use was mirrored in other construction-oriented commodities, with China consuming around 50% of the world’s production of materials like copper, steel, aluminum and coal.8
The underlying composition of China’s GDP also reflects China’s supercharged construction levels. While building fixed assets (“gross capital formation” in economic terms) makes up around 20-25% of most countries’ GDP, China has averaged roughly 45%,9 a level that no other major country has maintained.
Finally, China’s demographics have also been extremely supportive of economic growth. Generally, when looking at population change, forecasters consider the overall level of growth. With 130 million people added to the population from 2001-2016,10 China’s growth was unquestionably supported by overall population change. In our view, it is even more important to consider changes in the working age population as people in their prime working years of age 20 to 59 are the largest contributors to GDP.
Because of the One Child Policy, China experienced a highly unusual ”maturing” of their population with a significant increase in working aged people, as from 2001-2016 more than 100 million people entered the key 20- to 59-year-old category.
For over 20 years, China experienced what can only be called a Virtuous Circle of Growth
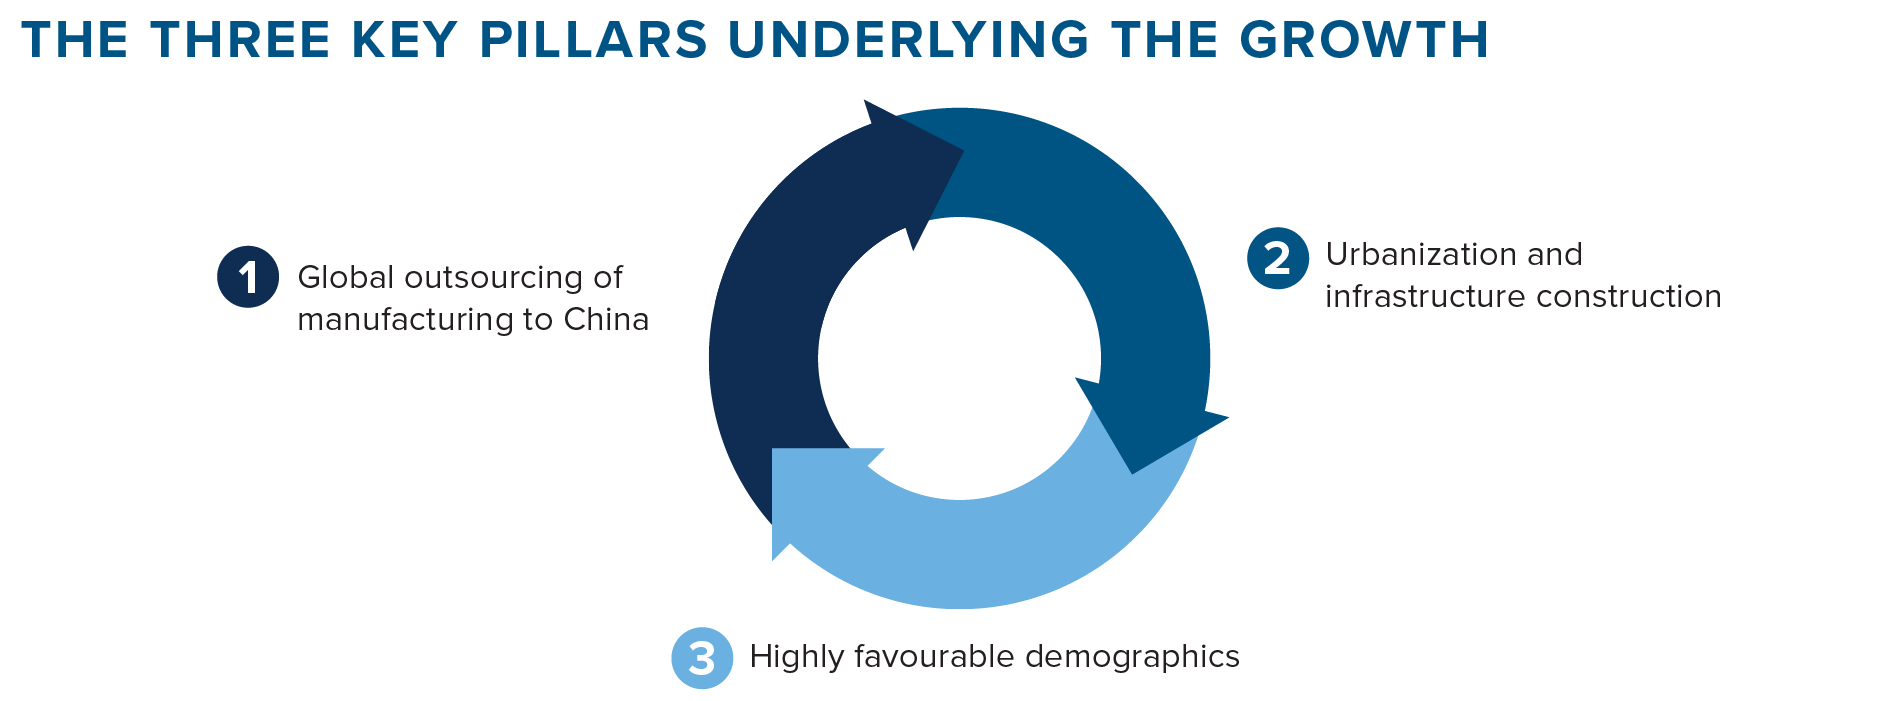
To see if this Virtuous Circle of Growth is set to continue into the next decade, we now turn to examining the current state of each of these growth drivers.
Growth engine stalling
Global outsourcing of manufacturing to China
Having achieved a remarkable 30% share of global manufacturing, China has begun to run into significant political backlash against further outsourcing. The political problems began with then-president Donald Trump’s 2017 initiation of an investigation into China’s trade practices11 followed by the imposition of a series of tariffs starting in 2018.12 Massive supply chain problems encountered during the COVID-19 pandemic lockdowns13 significantly heightened global concerns around supply chain vulnerability and the need for near-shoring or multi-sourcing of key components.14
In our own discussions with companies, we have noted renewed focus on supply chains and a clear desire to diversify sources of supply. In our view, shared by many of the management teams with whom we have spoken, this will be a slow process and is not easy to achieve. Nonetheless, when we look forward for China, it appears that the outsourcing wave, where China more than doubled its share of global manufacturing, has crested and may be receding. We are uncertain if this will create a headwind for China, but it appears clear that the growth tailwind has dissipated.
Urbanization and infrastructure construction
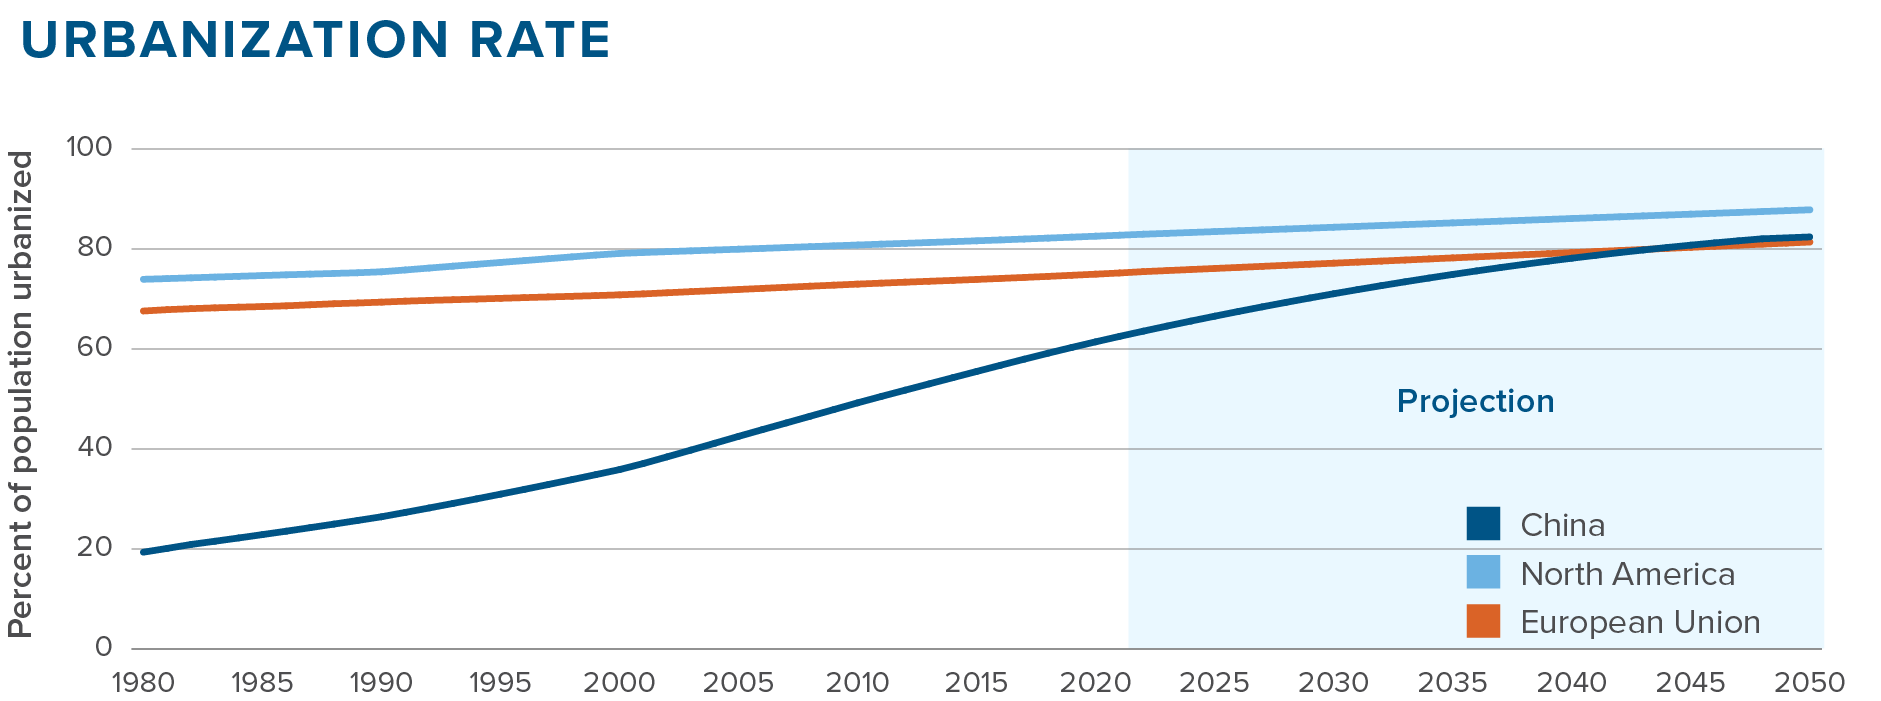
The remarkably rapid urbanization of China has resulted in extraordinary levels of construction as new cities sprang up in China seemingly overnight. In 1980, less than 20% of China’s population was urbanized, compared to around 65% today. At its peak, China was urbanizing over 20 million people per year, equivalent to half of Canada’s entire population.
Urbanization, naturally, has limits as most countries require a portion of the population to be engaged in agriculture and not everyone wants to live in a city. China’s internal estimate suggests that the country will reach a maximum 75%-80% urbanization level15 similar to most developed countries. A close look at the urbanization data16 shows that China’s urbanization rate has already begun to decline as it closes in on this ceiling level. At the peak levels from 2002-2012, an average of 1.33% of the population moved to the city each year. Over the past decade, that level has fallen to 1.19% and is set to continue to fall as China converges to the 75%-80% level. In the projection below, we assume that China will ultimately end up at over 80% urbanization, as there is some upward drift to urbanization levels in most countries over time. At that point, their urbanization level will be similar to that of the European Union.
What is not obvious in this chart is the implications for the number of people urbanizing each year, which is the key to China’s future housing and infrastructure construction needs. China’s population is generally viewed as having peaked or about to peak over the next two years.17 Post peak, the population is expected to begin a gradual decline. If we combined slowing urbanization rates with a falling total population, the number of people expected to urbanize in China each year appears to have begun a rapid and relentless decline.
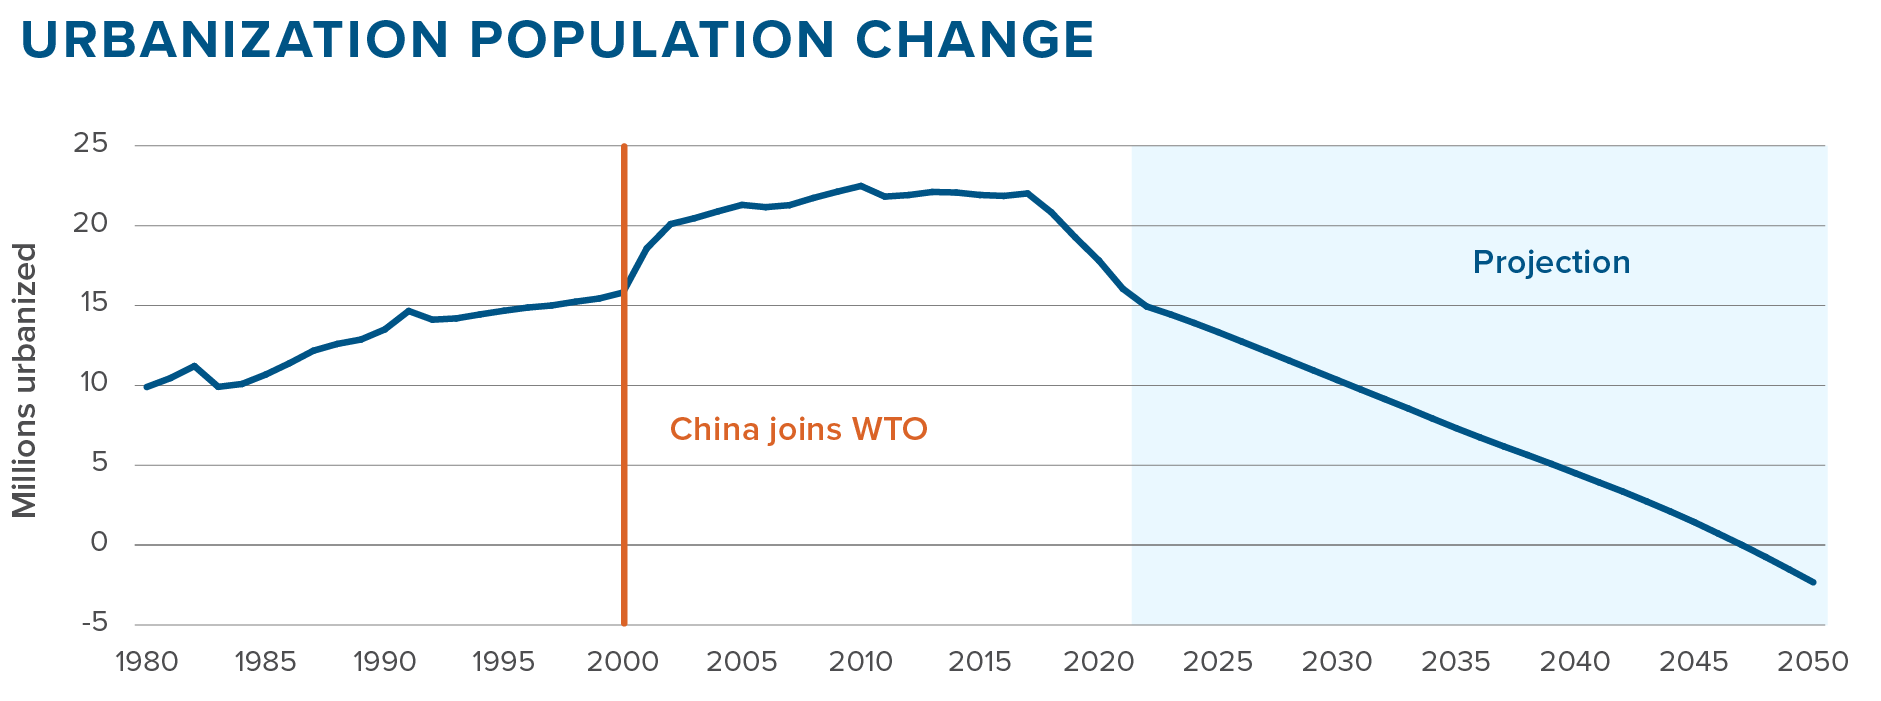
We believe that this decline, which began in 2018, is the underlying story behind the rising property sector problems that have begun to emerge in China. The country continues to build at a consistent pace, while the demand for new buildings appears to have begun to drop sharply. While shorter-term issues like tightening credit standards and a focus on reining in real estate speculation have exacerbated the problem, we believe that increasingly the challenge will come not from a lack of credit, but from a lack of urbanizing people.
Above, we noted that China’s fixed asset construction levels (“gross capital formation”) are significantly higher than normal. As economies mature, they typically experience a mix shift, with other GDP components (personal consumption, in particular) growing, while infrastructure and housing decline as a percent of GDP. This pattern is evident for India in the chart below but has simply not happened for China. It is important to keep in mind that India is a much less mature economy than China, with one fifth the GDP per capita. If anything, we would expect China’s fixed asset investment levels to be below India’s.
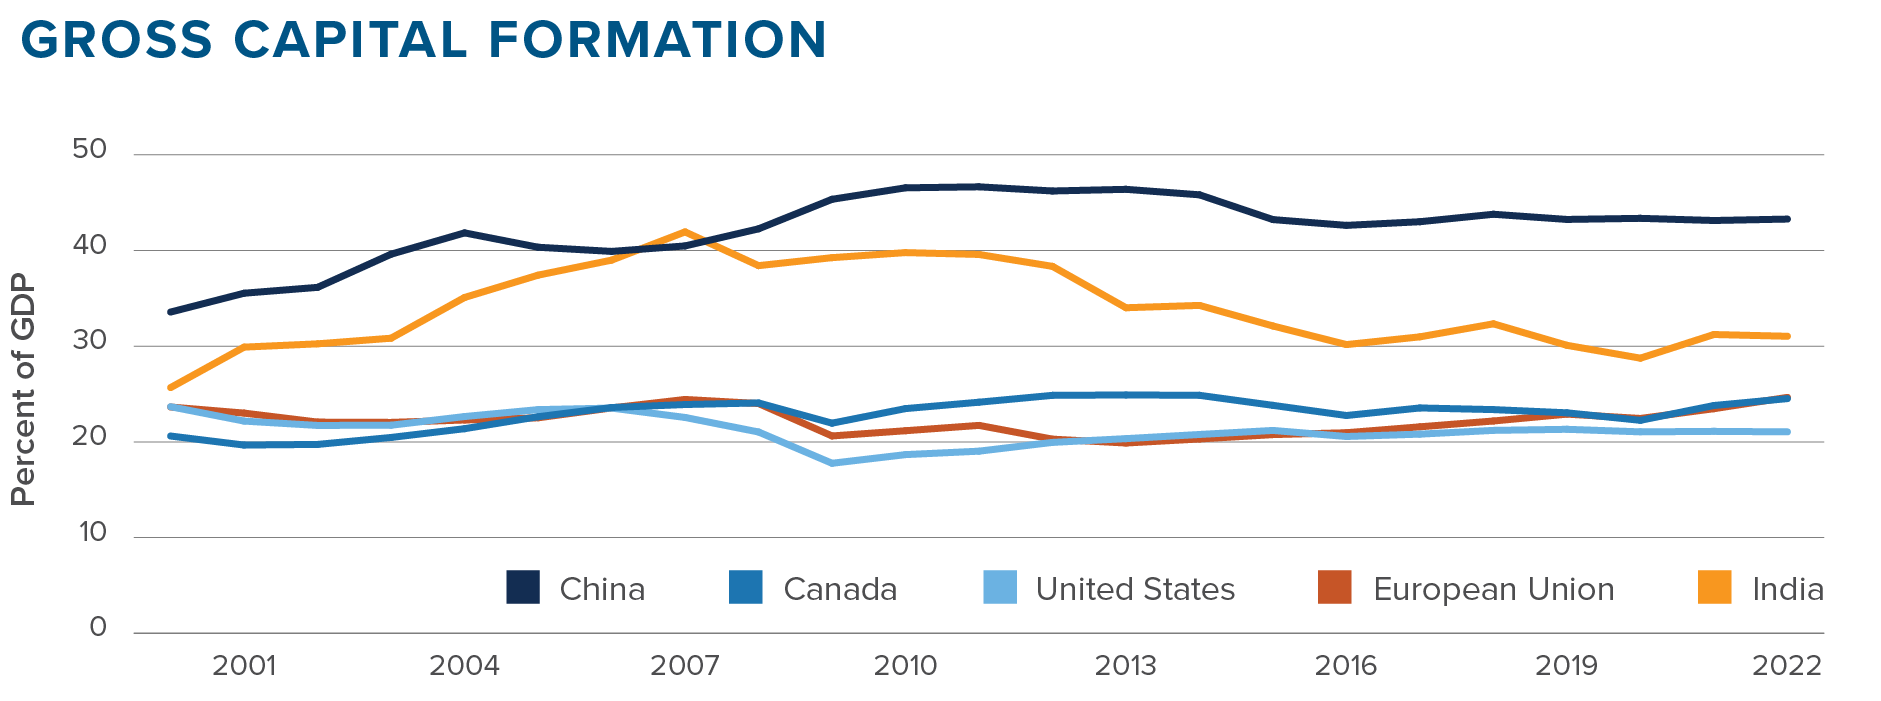
We believe that this chart may also shed some light on a long-standing puzzle on China’s economic mix. Since 2006, we have frequently encountered an argument that China is about to enter a golden age of consumerism, as China’s economy will “rebalance towards normal” through a doubling of consumption, leading to strong GDP growth. This view notes, as per the chart above, that China’s fixed asset investment is well above normal, but then assumes any rebalancing must come from a significant increase in personal consumption. In our view, something closer to the opposite seems far more likely — the economy will be rebalanced by a decline in construction activity as the drop in the number of people urbanizing spills over into a decline in construction demand. This will also ”rebalance the economy towards normal” but it will do so by cutting overall GDP growth.
As for all things China-related, the numbers are massive. If China’s asset investment levels abruptly dropped to match India’s current level, it would require a 40% decline in fixed asset investment, which equates to a drop in spending of roughly $3 trillion (USD) per year. While we certainly do not expect an abrupt drop, even a gradual adjustment downwards will be a significant headwind to China’s GDP growth and to demand for global building materials and related commodities.
Demographics
We discussed above that China’s population is now peaking and expected to begin a gradual decline. Over the next 10 years, China’s overall population is expected to fall by around 19 million people. While this is not a small number, in the context of China overall, it is relatively tiny. As a result, while there are demographic concerns over China, they are often viewed as something that will have a greater impact past 2030.
We do not share that view. If we examine the key prime work age 20–59-year-old demographic, the story is quite different.
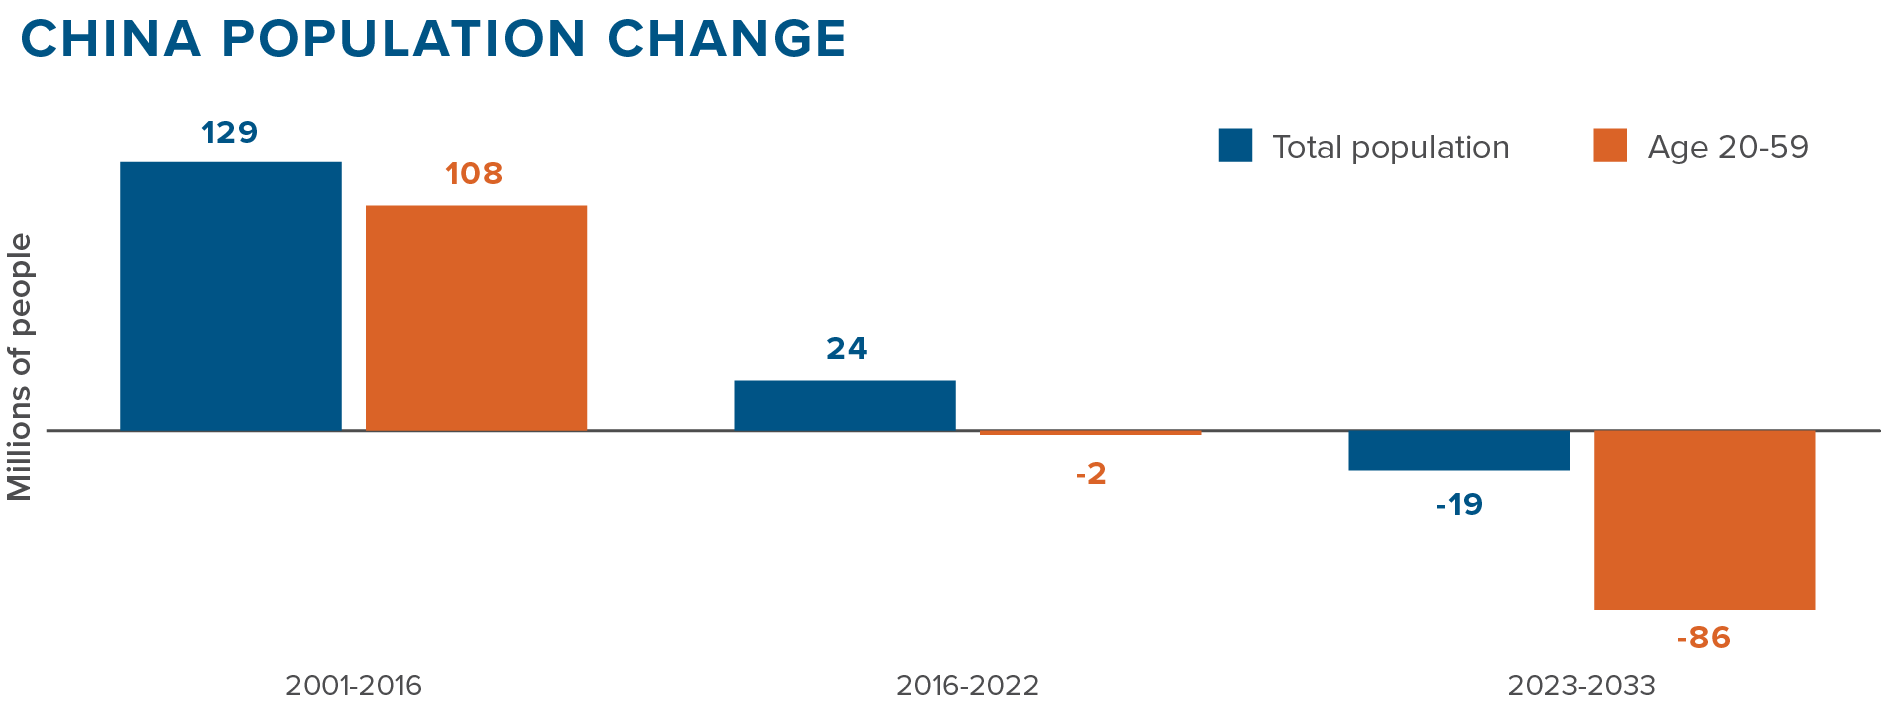
Due to the lagged impact of the One Child Policy, China’s working age population is set to fall by more than 80 million people across the next 10 years. The swing in demographics from a significant tailwind to a massive headwind over the next decade is clear in the chart above.
Final thoughts
In our view, China’s chapter of manufacturing and construction driven growth is ending. While China will undoubtedly remain a global powerhouse in both areas, the country needs to shift its growth model going forward. We believe China's leadership is acutely aware of this challenge. In recent years, China has begun a transformative journey to climb the technology value chain. The country is transitioning from being the world's assembly plant to becoming a formidable technology innovator.
The Australian Strategic Policy Institute tracks publications across cutting edge technologies in 64 different fields18 which we can use as a proxy for the level of innovation in each country. The technologies examined are extremely broad, covering diverse fields like artificial intelligence, biotechnology, robotics and advanced materials. When it comes to publishing research in the top-10% most cited publications, China is viewed as leading the world in 50 areas, versus the US in nine, and the EU in five. This suggests that China has rapidly moved from a technology laggard to a global leader. In addition, China has emerged as the dominant player in large emerging industries, including renewable power technologies,19 and electric vehicle (EV) technologies and production.20 We believe that these are clear signs that a new technology-oriented growth model is emerging in China.
This new model, which we believe is essential for China to continue to grow, is already showing signs of being much more politically contentious than the prior low-technology focus. China is now looking to disrupt large, well established, politically sensitive industries like automotive and semiconductors. The backlash has already begun with the EU looking to launch an anti-subsidy investigation into the Chinese EV industry21 while the US has acted to cut China off from cutting-edge semiconductor technologies.22 We believe that further conflict with the EU and the US is inevitable, as any industries that are large enough to be worthwhile for China to pursue will also be large enough to have political protectors. Whether China will be able to ramp up enough new areas of sufficient scale to offset the decline of their prior manufacturing and fixed asset-oriented growth model remains to be seen.
From an investment perspective, China has been a significant driver of global economic growth for the past two decades. As outlined in this whitepaper, the three tailwinds that fueled China's Virtuous Circle of Growth — global outsourcing, urbanization and favourable demographics — are now turning into headwinds. As a result, the country is now facing a difficult transition to a new model centered around technology and innovation. Investors will need to adapt to China's evolving economic landscape. Investments and forecasts that are based on China’s prior growth model continuing well into the future are likely to prove disappointing, while those that recognize the changing nature of China’s economy are far more likely to prove successful.
______________________________
1 China Property Crisis: 34 of 50 Top Developers Have Defaulted on Debt (businessinsider.com)
3 China stops releasing youth unemployment data after it hit consecutive record highs | CNN Business
4 China to Be Top World Growth Source in Next Five Years, IMF Says - Bloomberg
5 WTO | China - Member information
6 The National Accounts Section of the United Nations Statistics Division; Mackenzie Investments calculations
8 China's Staggering Demand for Commodities in One Chart (visualcapitalist.com)
9 World Bank; Mackenzie Investments calculations
10 Population data: Population of China 2023 - PopulationPyramid.net; Mackenzie Investments calculations
12 The timeline of Trump China tariffs and trade war (cnbc.com)
14 China’s Big Troubles: Its Days as Global Go-To Manufacturer May Be Coming To an End (forbes.com)
15 China’s Urbanization Level Will Exceed the 75% Ceiling – China-CEE Institute
16 Urban population (% of total population) - China | Data (worldbank.org); calculations Mackenzie Investments
17 When will China’s population peak? It depends who you ask (nature.com)
19 China Invests $546 Billion in Clean Energy, Far Surpassing the U.S. | Scientific American
20 China Is the World's Electric-Vehicle Leader. Here's How It Achieved That - Bloomberg
21 EU to launch anti-subsidy probe into Chinese electric vehicles (ft.com)
22 U.S. aims to hobble China's chip industry with sweeping new export rules | Reuters